Wednesday, May 31, 2006

Mortgage Rate: 4 year high


Mortgage demand dips as 30-year rate hits 4-year high of 6.66%

Borrowing costs on 30-year fixed-rate mortgages, excluding fees, averaged 6.66%, up 0.05 percentage point from the previous week, and matching a four-year high touched two weeks ago.

Fixed 15-year mortgage rates averaged 6.22%, down from 6.23%. Rates on one-year adjustable-rate mortgages (ARMs) increased to 6.09% from 6.02%.

Tuesday, May 30, 2006

Housing and Oil


As I see it, the two biggest problems facing the US are the housing picture and oil.

Housing IS the US economy. Two thirds of US families now own their own homes, and they've used their homes like ATM machines. They've refinanced and borrowed heavily against the value of their homes. They've considered the rising market value of their homes as "savings." But now inventories of new homes are surging and sales are dropping. The latest figures for the "'hot" state of California show that the median price of an existing home increased by 10.2% from April a year ago, but sales dropped 21.4%. In housing declines, turnover drops first, followed by prices. In California we're seeing the first signs of a seller's market turning into a buyer's market. Condos in areas like Las Vegas have become a drug on the market with some construction projects being called off.

Next, oil. You think the oil and energy picture is OK, that it will "take care of itself." Maybe it will, but I'm highly skeptical. Too many oil-producing nations are unfriendly to the US, and too many nations are ready to nationalize their oil facilities. And there is too much lying about the size of oil reserves.

Gold -- Over the years there's been a running ratio of the price of oil to the price of gold. In the past, an ounce of gold would have bought and average of around 20 barrels of oil -- but at extremes as much as 27 barrels of oil. Today an ounce of gold will buy only 9 barrels of oil. Currently, based on the ratio, gold is "too cheap" compared with the price of oil. I believe the current rising price of oil will be a bullish factor for gold. Gold is far too "cheap" in relation to the sheer amount of fiat paper money that has flooded the world. And gold is too cheap compared with the rising price of oil.

A month ago all the experts were warning about the parabolic rise in gold. What everyone knows ceases to be a factor where markets are concerned, and I was skeptical about the widely-advertised "parabolic" danger of a gold collapse. Now gold has become oversold, while still holding above its 50-day moving average. In the meantime, a lot of people have sold their gold and are waiting on the sidelines for lower prices.

You may have heard of BRIC. This stands for Brazil, Russia, India, China. These four countries are considered to be the four emerging economic giants. But suddenly, in recent weeks, the stock markets of these four hit the deck. Russia is down 17%, India is down 14%, China is down 11%, and Brazil is down 8%. But over the past year all are up over 50% -- with Brazil up a spectacular 113% and India up 62%.

These increases have come about partly as a result of heavy buying by US investors. I show the daily charts of the stock averages of these four big emerging markets, and the question is -- are these just "gut-check" corrections or have these markets topped out? The markets of the world are heavily dependent on the US markets and US consumer buying? So a further question is this -- do the markets of the world sense that "something is wrong" in the US?

All eight of the home builder stocks that I watch were down again today. This market is taking a "wrecking ball" to the housing stocks. I understand that 40% of all the houses bought last year were second homes. Madness is upon us. The last thing in the world most Americans need is a second home. They'll have all the problems they want with their first home.

Friday, May 26, 2006

Housing Stocks


I continue to believe that the housing picture could turn out nastier than just a "soft landing." And I believe the chart below backs me up. This is a WEEKLY chart of the Phila. Housing Index. The chart is just plain bearish. And by the way, this chart is the reason why I don't think Bernanke is going to raise short rates at the end of June.

If it's the market's function to look ahead, to discount the future, then I think housing in the US is in trouble. At least the home-building stocks think it's in trouble. Let me put it this way -- this is not a happy chart..

Thursday, May 25, 2006

Tuesday, May 23, 2006

Housing drop of 10%


Housing: 10% Decline May Trigger Financial Ruin


Astute reader Bob Decker wrote:
Many people don't seem to understand that if you put $100,000 down on a million dollar house . . . and the market drops just 10% . . .you lost your $100,000 of savings/equity and may not ever see it again.
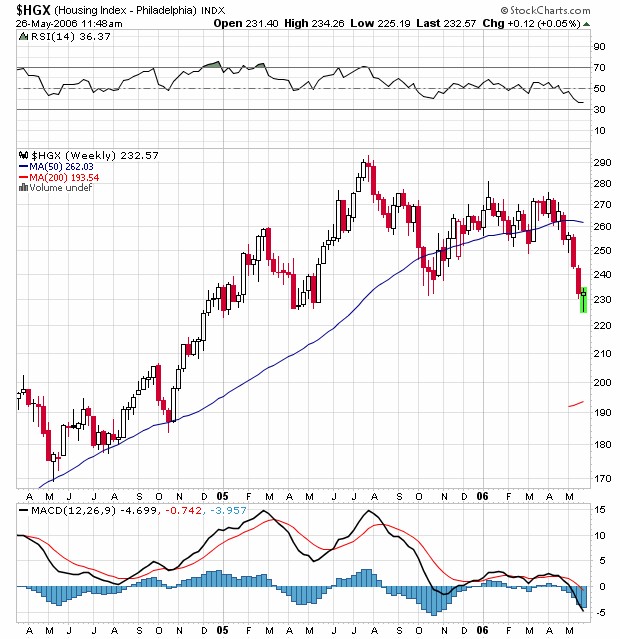
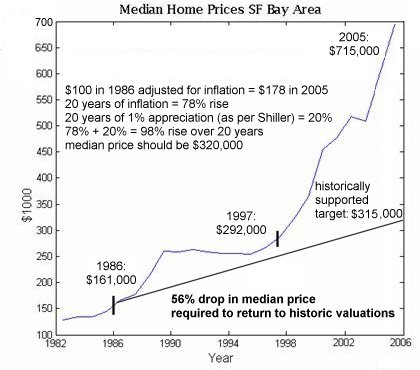
If you need evidence that prices are falling, consider this USA-Today story, median prices fall, just one of many media stories documenting the decline in both new and existing home prices.

Let's take Bob's point and extrapolate it a bit. Consider a family which bought a home for $400,000 at last year's market top, and now for one reason or another find they have to sell: someone lost a job, got transferred, developed a chronic medical condition, etc. In many markets, they will find that the values in their neighborhood and price range have already dropped; in areas such as greater Boston, a 10% decline appears to be common.

Let's assume that the family was one of the rare home buyers who took out a conventional mortgage, with 20% down payment in cash and a loan balance of 80%. (As documented here earlier, up to 60% of recent home buyers have selected no down, interest-only loans.)

So let's do the math, given a 10% decline in values since they bought:


down payment: $80,000 (balance of $320,000)
Escrow and loan origination fees: $8,000 (2% of purchase price)
total mortgage: $328,000 (fees added to loan amount)
Difference between cost of renting an identical house ($1,500/month) and owning ($2,500/month): $1,000/month or $12,000 a year

(Here are the assumptions, plugged into the calculator at MSN Money: $328,000 mortgage at 6% assumed in June 2005, payment = $1,966 /month, property taxes of 1.5% per year plus homeowners/fire insurance = $2,500/month payment)
Value of tax write-off of mortgage interest: $6,000
Net loss in owning compared to renting: $6,000

Now, on the sale:
Sale price: $360,000 (10% decline from $400,000 purchase price)
Pay-off mortgage of $324,000 (as per the MSN Money amortization chart, about $4,000 was paid off in the year of ownership), leaving cash of $36,000.
Deduct 6% realtor's fees and closing/escrow costs of 1%: $25,000. Cash remaining: $11,000
Deduct $6,000 net loss due to owning rather than renting: cash remaining: $5,000
Value of house they qualify to buy with $5,000 down payment, assuming conventional 20% down: $25,000
Locations of homes for sale for $25,000: Northern Siberia; suburb of Chernobyl; yurt in Mongolia (must be moved with seasonal movement of herd)

Let's be frank: this poor family which started out with a solid $80,000 and 20% down, has essentially been wiped out by a "mere" 10% decline in housing values, once actual transaction and ownership expenses are accounted for. As for those new homeowners who bought with no money down, this example shows that the transaction fees alone will drive them into bankruptcy, even if they sold the house for their original purchase price.

As this chart of the San Diego market illustrates, the number of homeowners exposed to rising mortgage payments is over 2/3 of recent buyers. Combine this with the large number of people who bought homes with no money down, and you get a fuller picture of the damage which will be wrought by a "mere" 10% decline in housing values in an era of rising mortgage rates and "resets" of ARMs to much higher rates.

(According to the National Association of Realtors, the median first-time home buyer's deposit last year was just 2% of the price, while 43% of first-timers put down nothing.)

Thank you, Bob, for making this all-too-easy to forget point about leverage: works great in a rising market, not so great in a declining market.
From: Charles hugh smith-Weblog

Monday, May 22, 2006

World Markets

Markets across the world have been collapsing, and I mean with major losses in many cases. And the weird part of it is that I have heard or read very little about it. And I certainly haven't heard of any reasons why it's happening.

I don't think it's just a correction of previous speculative excesses. The declines are too large for that. And the internal deterioration has been going on for too long. No, something else must be in the wind.

And suddenly, everyone is piling into what they must consider "the safest place to be" -- the currencies and even the US dollar.

But what about the broad, international weakness? Could it be this? Central banks the world over have been worrying about rising asset prices, with particular emphasis on housing. So far, the tightening has been working. I've been using charts to show subscribers that US building stocks have been "falling out of bed."

So question -- what if the housing picture in the US really turns bad? Remember, the US consumer has been the engine of growth for the whole world. If housing prices cave in, US consumers could turn pessimistic and cut back substantially on their spending -- they could (God forbid) even start to save. A US housing collapse could be deflationary and very painful -- and the resultant pain could spread across the face of the earth.

At any rate, I'm watching the US real estate picture very carefully. If US real estate is heading for a "hard landing," my prediction would be simply -- "Watch out!"

A correction of the real estate boom has started. The consensus is that real estate is in for a "soft landing." Alan Greenspan agrees with the "soft landing" position (why shouldn't he, he was responsible for the real state bubble in the first place?). But I'm not at all convinced that real estate is heading for a "soft landing." There's been too much questionable financing and far too much construction -- inventories of unsold homes and condos are now bulging.

My criteria of "whether housing is overpriced" is as follows -- if you buy a house, and you can't rent that house and cover all your expenses, then your house is overpriced (Martin Barnes agreed with me on this). In other words, renting today may be costly, but it's a bargain compared with buying a home

Thursday, May 18, 2006

New listings outpace sales: Contra Costa


Thursday 05/18/2006: Comparing the daily number of sold listings (red line) to the daily number of new listings from a month ago, we see the gap remains at approximately 150 units. Since it takes about a month to close an escrow, this means that the supply of new listings continues to outpace sales. We're hoping that this gap does not widen, but it doesn't look too promising.

Wednesday, May 17, 2006

US Biggest builders: stocks falling


The charts are telling me a story. If I'm to believe the charts, the story is that the housing boom is kaput -- it's over. The daily charts of three of the biggest builders in the US -- the Ryland Group, Toll Brothers and Lennar Corp. You don't have to be a chart genius to be able to interpret what these three charts are saying. In a word, it's "top-out" (or is that two words?).

At any rate, what these charts are telling us, I believe, will show up in the economy and in consumer spending before this year is out. And I think it's going to be deflation of the housing boom in both prices and the number of new houses that will be built.

Southern California and San Diego have been two of the hot spots of the real estate boom. Prices here have shot up to ridiculous heights. I think this area represents a sort of barometer of the housing industry. At any rate, Robert Campbell puts out a very interesting and unique report, "The Campbell Real Estate Timing Letter" (858-481-3235). This is actually the only report I know of that uses a technical approach to the real estate market.

Robert called the turn in real estate in his August 2005 report, and so far, I think he's been right on the ball. Robert does not believe we're heading for a "soft landing" in real estate. Writes Robert, "Housing prices in seven California cities could go into a steep downward spiral." This is a most interesting real estate report.

I note a remarkable split between the psychology and sentiment of the nation and what I see in the stock market. People, in general, seem to be content. Everybody's drinking four dollar Starbucks coffee. Kids coming out of college can get jobs (not necessarily good jobs, but jobs). Every other goofball walking the streets is glued to a cell phone. The malls are jumping, and the art auctions are going nuts.

But on the markets it's a far different story. The Dow is now plunging in over-100 point chunks, oil is still high-priced, gold is going high-volatile, and most importantly -- the home-builder stocks are swooning.

My view is that consumer sentiment is due to change radically by the third quarter of this year. The markets smell trouble, but the trouble isn't apparent -- yet.

Monday, May 15, 2006

Bay Area prices down from $715,000 to around $315,000


After the Bubble: How Low Will It Go?


How low will housing go as the bubble bursts? For an answer, let's turn to Irrational Exuberance by Robert Shiller (recommended here on May 3).

Shiller's book, which presciently predicted the collapse of the Nasdaq stock market in 2000 just weeks before that mighty bubble broke, has been re-issued with an analysis of the housing bubble. Shiller's key takeaway is that historically, housing in the U.S. rises, at best, at 1% per year not including the effects of inflation, that is, "real" appreciation. This chart depicts what history suggests will happen to housing prices: to return to this historically supported level, housing in the San Francisco Bay Area must drop 56%.

Impossible! you gasp in dismay. They're not making any more land, the population is growing, etc. etc. etc., all the "common sense" reasons given for why housing is in a permanent uptrend. Funny, but that sounds just like the truisms given when tech stocks like PALM and SUNW were over $100, just before they began their long, slow agonizing decline to $5. The Internet did "change everything" and it continues to grow rapidly, but those realities did not translate into overpriced $100 per share stocks rising to $200, as widely predicted at the time. Why?

There are two fundamental reasons why any bubble bursts: a statistical phenomenon called "reversion to the mean" and the deeply unprofitable nature of the bubble as a business is eventually revealed. Although reversion to the mean has technical definitions, for our purposes we can understand it as the law of averages; that is, a series of data will eventually revert back to the average. The farther it rises from the average, the higher the probability it will revert or return to historic averages. If the elk population explodes one season, for instance, then disease, overgrazing and a subsequent rise in predators all act to bring the elk population back down to historic norms.

In the world of investing, the growth stocks of the 60s, labeled the "nifty 50," rose to great heights before falling back to earth once their price-earnings ratios rose to nose-bleed levels. In other words, the amount of money they were making simply didn't support the price of their stocks. For an explanation of reversion to the mean which relates to investment, visit the coffeehouse investor.

Reversion to the mean is a statistical phenomenon, not an explanation. The underlying mechanisms for a reversion to the mean have been explored here in previous posts, and in many other sites: a veritable flood of cheap and easy money inflates the bubble, which inevitably deflates when loose lending standards are tightened and interest rates rise.

Nothing fancy here; it's also called "the business cycle." Natural growth rises to excess when excessive liquidity gooses it, and then collapses when that liquidity is withdrawn or begins to cost real money.

To borrow from Tolstoy: every healthy market is the same, but every bubble bursting is unique in its misery. There are plenty of absolutely bubblicious markets in the U.S. (and indeed, the world--check out Shanghai is you want a real fright), but I chose the one close to home: the San Francisco Bay Area. Shiller's analysis works on any bubble, anywhere, but obviously, the less dramatic the rise, then the less dramatic the decline.

This chart provides a very clear picture of what a bubble looks like: a slow rise in values which suddenly turns up in a hockey-puck ascent to unsustainability. Note that the decade between 1986 and 1997 ended with housing values a bit above the historic line, but not by much. During all those years of flat-to-modest appreciation, the population was also growing, they weren't making any new land, etc. etc.--all the conditions were present which are trotted out to justify the bubble. Note that the hockey-puck rise began as the Nasdaq bubble created hundreds of billions in new wealth in the late 90s.

Let's go over the numbers. According to the Bureau of Labor Statistics, $100 in 1986 equals $178 in today's (devalued) money. To that 78% rise due to inflation we add Shiller's 1% per year appreciation in "real" terms, which adds up to a historically supported value 98% above the 1986 median price of $161,000. In other words, a reversion to the historic mean will bring Bay Area median prices down from $715,000 to around $315,000--a decline of $400,000.

This is the inescapable conclusion of Shiller's analysis and historical trends dating back to the 19th century. It cannot be denied; but you can of course retreat into denial. Sadly, that's what most investors did back in the dot-com heyday. As stocks tumbled, every brief uptick was embraced as the "bounce back" to the good old days, and every such bounce was a sucker's rally, leading only to further precipitous declines.

For the median prices in Boston, Austin, Raleigh and the Bay Area, go to median housing price data from 1986 to to 2005 courtesy of the University of Texas.

From: www.oftwominds.com/blog.html

Wednesday, May 10, 2006

Gold

Today the numerous warnings about "a gold correction" have become almost deafening. Now we have a crowd of "experts" telling us to take profits in gold because "gold is in a parabolic rise." The problem is that these experts don't know whether we're in the first 10% of the parabolic rise or the last 10% -- or in the middle.

In the big picture, I'm betting that the bull market in gold has much further to go. I base this on a number of items, but here are a few of them.

The US public hasn't bought any gold at all. It doesn't even know what a gold coin looks like.

The central banks of the world are continuing to create oceans of junk paper money.

The US is continuing to generate multi-billions of dollars of credit and debt.

The Iraq and Afghanistan wars are now costing $10 billion a month. The wars, among other things, are wrecking what's left of the US budget.

The US is spending more on its military than the military spending of the rest of the world combined.

The US has $50 billion in unfunded liabilities in Social Security, Medicaid and Medicare. Great quantities of new paper will have to be created to cover these costs.

To address the current account deficit, the US wants the dollar lower by 25%. This will intensify the war of competitive devaluations.

George W. Bush has wracked up more in debt than the combined debts accumulated by all the previous presidents in US history. And incredibly, Bush has yet to veto a single spending bill.

The US's creditors have been financing the US current account deficits to the tune of over $2 billion a day. Now they are starting to worry about the viability of the US dollar. In fact, some of the US's creditors are beginning to "diversify." To the extent that the US is "owned" by its creditors, to that extent the US loses control over its own finances. There's no way this can last. In time, our creditors will pull back, take their losses, and let the dollar go.

The rest of the world increasingly resents the Bush administration's arrogance and saber-rattling. At some point they will unload their trove of US assets, sending the dollar reeling.

Thus, it's clear that much of the strength in gold stems from gold discounting a declining dollar.

I count gold closing up 15 out of the last 18 days which is technically ridiculous and super-extreme. Yet gold is up in the aftermarket this afternoon, but it's hard to believe that gold won't correct, at least slightly, over the next few days. Gold now outperforming silver. Gold shorts getting their Baptism of Fire.

Tuesday, May 09, 2006

Warren Buffett: on real estate


On the real estate bubble

Buffett: May 8th, 2006 speech: "What we see in our residential brokerage business [HomeServices of America, the nation's second-largest realtor] is a slowdown everyplace, most dramatically in the formerly hottest markets. [Buffett singled out Dade and Broward counties in Florida as an area that has experienced a rise in unsold inventory and a stagnation in price.] The day traders of the Internet moved into trading condos, and that kind of speculation can produce a market that can move in a big way. You can get real discontinuities. We've had a real bubble to some degree. I would be surprised if there aren't some significant downward adjustments, especially in the higher end of the housing market."

On mortgage financing

Munger (Buffett's partner): "There is a lot of ridiculous credit being extended in the U.S. housing sector."

Buffett: "Dumb lending always has its consequences. It's like a disease that doesn't manifest itself for a few weeks, like an epidemic that doesn't show up until it's too late to stop it Any developer will build anything he can borrow against. If you look at the 10Ks that are getting filed [by banks] and compare them just against last year's 10Ks, and look at their balances of 'interest accrued but not paid,' you'll see some very interesting statistics [implying that many homeowners are no longer able to service their current debt]."

Monday, May 08, 2006

Discounted asking prices


Monday 05/08/2006: Just when we thought the market's rebounding came spring time, this spring rally appears to be dissipating rather quickly. In the month of April, Sellers accepted, on average, a discount of $4,194 from their asking prices. This makes it the worst April (for home sellers) comparing to the same month in 2004 and in 2005.

Sunday, May 07, 2006

Toll Brothers: orders down 33%


Looks like the Fed has the nation on steroids. And it's not only the Fed, it's the central banks of the world. You see, nobody wants an "over-priced" currency, because everybody wants to sell to the US. And it's a very competitive world (think China and India and Asia), so if you want to sell to the US you have to compete, and that means you have to have a competitive currency. How do you keep your currency cheap against the dollar? Easy, you churn out a load of your own currency and with it you buy dollars. This keeps the dollar up and in comparison, your currency remains competitive.

Of course, when you're manipulating like this, there are always problems. One problem, if you want to call it that, is that there is one hell of a lot of paper money swishing around the world. In fact, you can say that the world economy is floating on an ever-rising ocean of paper money.

Well golly gee, isn't that inflationary? You bet it is, and the inflation is starting to hit full force. First it hit world real estate and housing, then it hit raw materials and oil, and now it's hitting everything consumers use -- such as food, transportation, college tuition, medicine -- well you name it.

You think gold is going up because of Iran or Iraq or because of less production from the gold mines? Forget it, gold is going up because it's reflecting and discounting coming inflation. You can call gold "real money" or you can call it the "golden barometer of inflation." Either description is accurate and either one will do. When the world goes mad, men seek the protection of gold. It's as basic as that.

What we're seeing now in gold and silver is the biggest story of the year and probably the biggest story since the great bull market since stocks topped out in 1980. Only the public, the crowd, the masses, don't see the story yet. But the markets see it. And I see it, which is why I keep writing about it. I've been on this story for about five years -- pushing, urging, cajoling my subscribers to "get with the story," and, of course, the story is the coming inflation and the revival of gold.

Toll Bros., the nation's largest builder of luxury homes, just announced that second quarter orders for homes dropped 33% as customers waited to see whether a glut of homes on the market would lead to lower prices.

I continue to believe that Bernanke's biggest worry is that the home-building boom will cave in, thus turning consumers bearish and halting their buying spree. This was, I believe, the reason why Bernanke talked about a possible halt to the Fed's boosting of short rates. However, with inflation now heating up, Bernanke is caught between a potential housing slide and rising inflation. What will he do? Will he halt his rate boosts or will be keep raising? That's what the market is wondering about.

Thursday, May 04, 2006


Thursday 05/04/2006: The number of properties for sale in Alameda and Contra Costa counties had just exceeded 10,000-unit benchmark as of yesterday. When the inventory increased to 8,000 units in November, we mentioned the probability of inventory increase to over 30,000 units by the end of 2006 provided that the pace of the inventory buildup continues at that rate (quadrupled over approx. 12 months). Well, going from 8,000 units in November to yesterday's 10,044 units, a third of that had just been accomplished. What is going on in your County or City. Will this finally start to put pressure on pricing.

Home builders


I follow seven of the major home builders. All seven are either breaking down or close to breaking down. I gather that the inventory of single homes and condos is building. From what I hear, New England has the largest build-up of unsold homes in the nation. In rapidly-growing Las Vegas ten major projects have been halted or put on hold.

On top of this, defaults are increasing -- in San Diego County defaults are climbing with a vengeance. Interest rates are pushing ever-higher, putting pressure on home-owners with variable rate mortgages. I'm just saying that the stocks of the big home-builders appear to be topping out. If this means anything, we should know about it in the next few months. Let me put is this way -- I'm not ready to go out and buy a second home as an investment at this time.

I suspect that if the real estate industry is in trouble, then the economy of the US will shortly be in trouble.

Wednesday, May 03, 2006

Royal road to riches: compounding


Back in the 1960s the old Union Carbide Corporation would send out a very valuable little spiral-bound booklet. They sent it free for the asking. The booklet was entitled simply, "Compound Interest Tables." Later Dow Jones-Irwin put out a marvelous little book. It was called the "Dow Jones-Irwin Guide to Interest. What You Should Know About the Time Value of Money." These were the two best investment books I've ever read, and believe me, I've read a lot of investment books.

I've always called compounding "the royal road to riches." I don't know whether anyone publishes compounding tables any more, but I know I spent many profitable hours studying those tables. In fact, I based my whole investment philosophy and my career on the basis of what these compounding tables taught me.

The process of compounding assets that throw off interest or dividends is a fascinating and wonderful experience. Baron Rothschild (who was a very rich gentleman) was once asked whether he could name the seven wonders of the world. The Baron confessed that he could not, but then he added, "I do know the eighth wonder of the world -- it's called compound interest."

The process of compounding interest-bearing or dividend-paying assets is a wonderful procedure. But sadly, I must tell you that there's a reverse side of compounding -- and the reverse side is the very devil. I'm talking about the process of compounding debt. This is exactly what the US is doing. We've built a monstrous edifice of debt -- debt so incredibly huge that the world has never seen anything like it -- and this debt is compounding daily, weekly, monthly, yearly.

The compounding of the debt process is relentless, and it will eventually grind us under. But there's a way to fight compounding debt. You can simply renege on it, declare bankruptcy and start over. But the US will never do that. You see, there's a second alternate route. You can devalue your currency, which is just another way of saying "instant inflation." Or you can devalue slowly, let the dollar sink bit by bit. And, of course, you can raise taxes which will help a government pay off the interest on its debt.

As I said at the beginning of this piece. I'm a sort of an amateur-expert on the compounding process. And I'm thinking that the total debt of the US has gone so far that it's past the point of no return. This means that to avoid national insolvency or bankruptcy, the US must inflate, probably by systematically devaluing the dollar. It's INFLATE or DIE.

Now we come to the essence of this short piece. As the dollar is devalued, it requires more and more of these fiat dollars to buy a unit of real money, intrinsic money, money that can not be devalued. And, of course, I'm talking about gold.