Monday, February 26, 2007

USA Today: largest circulated paper in the county


Growing trouble in the subprime mortgage industry poses the greatest risk to financial markets right now.

The forecast by NABE, which polled 47 top economists, called the subprime sector a more serious concern than hedge funds, which came in second.


Subprime mortgage lenders provide higher-priced loans to consumers with impaired credit. Defaults and delinquencies among subprime borrowers have jumped since late 2006, and a number of lenders have shut down or scaled back their operations.

On Wednesday, for example, shares of subprime lender NovaStar Financial plummeted more than 42% to $10.10 after it announced a fourth-quarter loss of $14.4 million. Company officials said they weren't sure they'd post a profit in the next five years.

While the NABE finding illustrates concern about escalating problems in the subprime sector, it doesn't mean economists expect the difficulties to spark broader financial stress. Overall, they expect steady economic growth in 2007.

"The outlook for consumer spending, which is the one that might be hit the highest by mortgage delinquencies and defaults, was actually revised upward," says Carl Tannenbaum, NABE president and an economist at LaSalle Bank.

The economists predict that the U.S. economy will expand at a 2.5% to 2.6% annual rate in the first half before accelerating to around 3% later this year. Growth is expected to average 2.8% for the year, in line with earlier NABE reports.

Housing will continue to be the biggest drag on growth. After five years of a boom market, housing starts have plunged in the past year.

The jobless rate, now 4.6%, is expected to inch up to 4.7%, the NABE says. Corporate profits, which rose by an estimated 19% last year after taxes, are projected to rise by a far more modest 5% in 2007.

Wednesday, February 21, 2007

Novastar subprime: Who's next


NovaStar Financial Inc. plunged today, falling as much as 45 percent after the company reported a fourth-quarter loss and said it would have little taxable income through 2011.

Shares of the Kansas City subprime mortgage lender fell as low as $9.80 before closing at $10.10, down $7.46, or 42.48 percent. The percentage decline was the biggest on the major U.S. exchanges.

Volume of more than 22 million shares was eighth highest on the New York Stock Exchange and more than 14 times the three-month daily average of about 1.5 million.

The price of NovaStar shares had fallen by about half in the last two months ahead of Tuesday’s announcements on concerns about weakness in the housing industry and growing mortgage defaults. Shares had closed above $31 a share as recently as Dec. 6. and now: $9.80 Ouch!!!

Is this the canary in the coal mine? Who else is in trouble?

Tuesday, February 20, 2007

Sacramento in USA Today


By Noelle Knox, USA TODAY
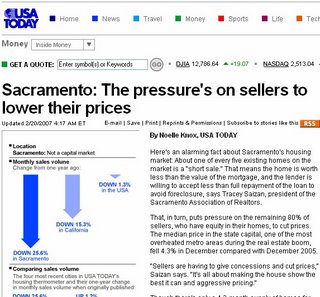
Here's an alarming fact about Sacramento's housing market: About one of every five existing homes on the market is a "short sale." That means the home is worth less than the value of the mortgage, and the lender is willing to accept less than full repayment of the loan to avoid foreclosure, says Tracey Saizan, president of the Sacramento Association of Realtors.

That, in turn, puts pressure on the remaining 80% of sellers, who have equity in their homes, to cut prices. The median price in the state capital, one of the most overheated metro areas during the real estate boom, fell 4.3% in December compared with December 2005.

"Sellers are having to give concessions and cut prices," Saizan says. "It's all about making the house show the best it can and aggressive pricing."

Though there's only a 4.3-month supply of homes for sale — a bit lower than the long-term average — that figure doesn't include the 3.5-month stock of unsold new homes that are also on the market, especially in some suburbs.

New-home sales in the fourth quarter were up nearly 57%, but that was compared with a dismal quarter at the end of 2005, according to The Gregory Group, a new home information and consulting firm. The median new home price fell 4.7% to $434,990, which doesn't take account of all the free goodies that builders are giving away, such as kitchen upgrades.

Still, builders are now seeing a decline in the number of buyers who are canceling their purchase contracts. "There is a sense that we are going through the tunnel, and the light at the other end is sunshine, not another train heading at us," says Greg Paquin of The Gregory Group.

Thursday, February 15, 2007

Housing Bubble


From Patric.net:


Q: What makes you a real estate bubble believer, a bubble debunker, or bubble neutral?

A: Owners and real estate businesses have a large vested interest in downplaying the bubble, no matter how real. Most renters are neutral, since they would probably rent anyway and don't really win or lose regardless of what happens to owners. But there is a small contingent of renters-by-choice who are adamant bubble believers and have made a big bet on it by renting. I'm one of them.

Q: How do you define a housing bubble?

A: Easy: when the monthly loss in interest, property tax, insurance and maintenance is larger than the monthly loss from renting, there is a housing bubble. Historically, it has been cheaper to own. That's how landlords can make a profit (duh). That's no longer the case in the San Francisco Bay Area. Since it's not only cheaper to rent now, but a whopping two to three times cheaper to rent the exact same thing than to own it, we clearly have the mother of all bubbles on our hands.

Q: How does this definition fit (or not fit) the national housing market? Which regional or local housing markets have exhibited the most bubble characteristics?

A: The national housing market does seem bubbly, but I don't know national average rents compared to owning. In the San Francisco Bay Area, where I live, it's clearly an extreme bubble. Other bubbly places now deflating are Boston, New York, Florida, Las Vegas, Los Angeles, and San Diego. Places with no bubble are generally those away from the coasts, where house-price inflation did not really take hold.

Q: Which bubbles burst? Which ones have deflated? Which ones are inflating? Which are about to pop?

A: I would say Boston has certainly burst now, but may continue to decline for years. New York, not so much yet. Florida is bursting, as are Las Vegas, Los Angeles and San Diego. The San Francisco Bay Area has declined only a little over the last year, but I think prices will continue downward for five years or more. Remember that prices fell for 14 years straight in Japan. So much for "real estate always goes up." I don't think there are any areas that are still inflating, especially now that there is a lot of attention in Washington focused on lending standards. The Bay Area is at very high risk for major declines. There was no reason for prices to double, so there is no reason they cannot fall right back down. Population actually declined, jobs went away, salaries went down and yet prices went up -- excellent illustration of a bubble.

Q: Are there any common traits among the bubble markets?

A: Yes, in general the bubble markets are more affluent and on the coasts. The feeling was that it must be safe to buy on the coasts because they are wealthier, but the reality is that buyers were not looking at very simple predictor ratios, like percentage of vacant houses, the ratio of salaries to house prices, the fraction of ARM (adjustable-rate mortgage) loans that are about to adjust dramatically upward and so on. Even though the populations in these areas should know better, they are running purely on gut feeling and not on the numbers. The numbers are now overpowering gut feeling. Foreclosures are rising exponentially.

Q: What is your best evidence for or against a housing bubble?

A: I can rent a million-dollar house for a little over 2 percent per year, but I cannot borrow $1 million in cash for 2 percent. It would cost more like 6 percent to rent (i.e., borrow) $1 million in cash. This proves that buyers are overpaying for houses by about a factor of three in the Bay Area. And this does not even consider the property taxes, insurance, maintenance and broker fees.

Q: Is it possible to accurately identify the existence of a bubble before it is gone? Explain.

A: Of course. When prices are extremely high by every measure ever used, it's a bubble. Price to salary ratio, price taking inflation into account, price compared to renting, etc., (are) all very high.

Q: How are bubbles born and how do they die?

A: Low interest rates have a nonlinear effect. That is, when interest rates go down from 5 percent to 4 percent, prices increase 20 percent (one-fifth). When rates go down from 4 percent to 3 percent, prices increase 25 percent. When interest rates hit zero, anyone can borrow an infinite amount of money. Once these crazy loans affect the market prices, the bubble takes on momentum and prices rise for a while just because everyone expects them to keep rising. And then interest rates go up and it all runs in reverse.

Q: Why do people get so fired up about the concept of a housing bubble?

A: There is huge psychological tension around the massive amounts of money involved. Buyers want to believe they did the right thing and will believe it no matter what the numbers in front of their eyes are. Renters-by-choice also want to believe they did the right thing, but most renters don't give a hoot about the whole affair.

From: www.Patrick.net
Wednesday, February 14, 2007

Silver - Gold - Housing

Big investment money has moved into almost every free or even semi-free nation on earth. For instance, China has massive investments in Taiwan, Taiwan has major investments in China, Dutch private interests have large investments in Africa, US private interests have investments almost everywhere -- and so it goes, big money, private money, powerful money -- crisscrossing the economies of the world.

Again it's a case of follow the money. And there's almost no place today where big money, corporate money, private money, is not involved. Nations and individuals don't like to jeopardize their investment, and nations are run by powerful men. Behind every nation you'll usually find men who are quietly "pulling the strings."

I believe that globalization of investments will prove to be a major barrier to war. As an example, US corporations now have huge investments in China. For this reason, regardless of political arguments that we may read about in the newspapers, I consider it almost unthinkable that the US would engage in war with China. There's just too much money involved and at stake. And never before in history has money been so globalized. I think it's a good thing; I think it favors international safety.

Now I want to talk about silver. Silver is a much-wanted metal. Unlike gold, silver is both used and used-up in industry. Silver is a great conductor of electricity. Silver, in the past, has been a monetary metal. The dollar was originally defined in terms of silver, not gold. Silver has been in deficit for the last six years, meaning that more silver has been used than produced. The world needs more silver. The US government's stock pile of silver, once enormous, is now gone.

Silver is heavy, but it is not as heavy as gold or platinum. If you've ever picked up a hundred-ounce bar of silver you know that it's heavy. Which means that large quantities of silver are difficult to handle and difficult to store. But now there's an Exchange Traded Fund under the symbol SLV. This fund actually puts away silver when you buy its shares. In a phrase, SLV is the easy way to own actual silver.

The silver chart pattern is bullish long-term, secondary-term and near-term.

Back in the frenzied days of the late-1980s silver rose as high as 50. That's better than three times the current price of silver. Personally, it wouldn't surprise me to see silver move up to 50 again as the great bull market in precious metals moves on. I've shown on previous sites that silver is outperforming gold. If gold rises, silver rises more in terms of percentages.

I think silver as a metal is cheap today, cheap compared with gold and cheap compared with platinum and, well, just plain cheap. A good value.

Back in December 1999 one ounce of gold would buy only 15 ounces of silver. Then the ratio swung in favor of gold, and by February 2001 one ounce of gold would buy 94 ounces of silver. But since February of 2001 silver has been gaining on gold. As of yesterday, one ounce of gold would buy 47.7 ounces of gold. I think we're heading for a ratio of at least 1 to 25, meaning that one ounce of gold will buy only 25 ounces of silver.


Powerful market today, and this kind of strength with all three D-J Averages at new record highs doesn't usually reverse in a hurry. The is a worldwide phenomenon with markets in almost every country heading higher.

Silver and gold are really still in their bases. The excitement in precious metals lies ahead. This is still the accumulation stage. I bought more SLV yesterday and again today. In precious metals, this is the time to think in terms of ounces, not price.

Monday, February 12, 2007

Interest rates and housing


Bloomberg columnist Caroline Baum's latest piece. Caroline is a firm believer in the predictive abilities of the yield curve. And it's true, the yield curve, over time, has proved to be the most accurate of the leading indicators.

Think about this -- the current yield on the 10 year T-note is 4.76%. The yield on the 91-day T-bill is 5.02%. Why would a sophisticated investor buy a 10 year T-note with a 4.76% yield when he could buy a T-bill with a 5.02% yield? The answer is that investors don't think the 5.02% yield will be around for too much longer. Therefore, lock in the 4.76% yield for the next ten years. But question -- why wouldn't the 5.02% yield be around?

First, you have to remember that the bill yield is closely tied to the Fed Funds rate, which is an artificial rate chosen by the Fed. But the yield on the 10 year note is a free market rate, arrived at by the consensus of market opinion -- it's a rate created by investors who've put their hard-earned money on the line.

Now suppose the free market yield is correct, and it's below the Fed's arbitrary Fed Fund yield? The yield curve is then inverted, and that tells us that the market thinks the Fed is wrong and that short yields will soon be heading lower in line with the market's opinion.

And that's where we are now, the inverted yield is saying that the bond market along with the PIMCO crowd believes the economy is going to "soften" in coming months and as a consequence yields in general will be heading lower.

I wouldn't argue with that opinion or "forecast" at all. So let's just suppose that the economy does soften in the months ahead. My first thought is that housing is going to get hit -- and hit probably harder than it has been hit so far. If this happens, the Fed is going to "freak out," because a "hard landing" in housing is the one thing the Fed does not want to see.

What would be the Fed's reaction be to a softening economy and a further unraveling of the housing situation? The Fed's reaction would be to bring rates down and keep the money spigots wide open.

This in turn would impact on the dollar while sending gold higher. And I'm wondering -- is gold sensing that scenario now? Is this why gold has been moving up along with silver and platinum?

As far as the stock market is concerned, that there are few signs of downside pressure. Keep you eye on the new lows, which have not been higher than 30 all year. So far, nothing's breaking to new lows.

Interestingly. all three D-J Averages hit record highs last week. But by the end of the week, Industrials and Transports had turned down (but not the Utilities), thus creating what technicians term "key reversals." These reversals are usually distribution phenomena, and as such, they tend to be followed by lower prices.

Monday, February 05, 2007

Stocks and liquidity


IF the current month of February turns out to be an up-month, that will mean that we've experienced eight consecutive months in which the S&P has been higher. This has only occurred ten times since 1926. Furthermore, six of those earlier strings produced a ninth up-month, meaning that February has a fair change of being an up-month.

Another amazing fact is that this string of consecutive rising months has occurred in the face of the majority of investor interest being centered in foreign markets. Fact -- since the beginning of 2005 a full 85% of all money going into mutual funds has gone into international mutual funds. And last year, according to Citigroup, 92% of mutual fund money went into international funds.

What's going on? What's going on is massive liquidity, greater than anything ever seen before. According to one fund manager discussed in Barron's, "The 'super-liquidity' cycle of the current recovery had unique antecedents. Mostly, it is a result of excessive Fed monetary stimulation that occurred earlier in the decade in reaction to the dot.com meltdown, the 9/11 terror attacks and fear in 2003 that the US might sink into the same deflationary abyss as the one that engulfed Japan.

"Only this time the Fed manufactured liquidity-surge became a global phenomenon because China and other emerging nations pegged their currencies to the US dollar. China has more than $1 trillion worth of foreign currency reserves, a large portion of them in dollars."

The result of all this paper money has been to levitate the markets of the world higher, and this includes the base metals, the precious metals, housing around the world, commercial real estate, and stocks in almost every nation in the world. On top of the surging liquidity, we have globalization as three billion people move into the modern world. This has set off a rush to buy up or tie up natural resources from South America to Canada, from Africa to Australia. It's as if some all-powerful spirit had suddenly swept across the face of the earth, unleashing forces never seen in these quantities before. Without the discipline of gold, "follow the money" has taken on a new meaning. The meaning is this -- never in all history has there been so much money to follow. Unlimited amounts of fiat money have washed over the planet, and, so far, nothing has halted the flow.

One of the main sources of this fiat money has been the Land of the Rising Sun. Japan has been fighting deflation ever since 1990. In the process of fighting deflation, Japan cut borrowing rates to an unprecedented zero while spewing forth multi-trillions of yen. Even now the yen provides an absurdly low interest rate of .25%. The low-return has driven the yen to a four-year low against the euro and the dollar. The "give-away" cost of the yen has created the so-called "carry trade," which allows speculators to borrow yen at practically no cost, and then turn around and buy a higher-yielding security. The continuing low interest rate on the yen has caused some to claim that the Bank of Japan has been "high-jacked" by business interests who want to continue with their carry-trade operations.

Then we have the hyper-spending with President Bush presenting a mind-blowing budget of $2.9 trillion. This from the San Diego Union, Feb. 3. "President Bush will ask congress for nearly three-quarters of a trillion dollars in new defense spending Monday, including $245 billion to cover the cost of fighting in Iraq and Afghanistan and other element of the 'global war on terror,' senior officials said yesterday." And I ask myself, can any currency hold together for long under this kind of wild spending? I guess we'll know soon enough. The US tower of debt continues to grow, incredibly our debt is costing the US over $300 plus million every 24 hours. We're compounding our way into either bankruptcy or runaway inflation. It's the same story I've been warning about for years. I call it "Inflate or Die."

In the face of this ocean of money, stocks, particularly foreign stocks, have headed for the moon.