Thursday, August 31, 2006

Housing Chart


The Index of "Housing Affordability" was 104.3 in June -- in July it dropped to 102.8, lowest reading since August of 1986.

The Conference Board's Index of Consumer Confidence declined 7.6 points in August from the July figure, its lowest level since November of 2005.

The leading Indicators hit a high last January and have been dropping since.

The "hard landing" vs. "Soft Landing" arguments regarding real estate/housing continue with economists on both sides giving their reasons. Personally, I've been more impressed by the "school of hard landings" as espoused by Paul Kasriel of the Northern Trust and by Prof, Nouriel Roubini of New York University.

Alcatraz cam ~Live Webcam~

Wednesday, August 30, 2006

Mortgage Applications: lowest in three years


Mortgage applications fell for the first time in four weeks as demand for home purchase loans dropped to the lowest level in nearly three years

The index fell 1.6% to 375.9, its lowest since November 2003. The purchase index, which is considered a timely gauge of U.S. home sales, was substantially below its year-ago level of 470.6.

Subprime lender's stocks:

HR Block: Today 20.30 _____ 1 Year Range: 19.80 - 27.59

Novastar Financial Inc. Today 29.90 _____ 1 year range: 24.08 - 38.49
.

WaMu: 30 Billion in bad loans


In an indication that there was reason to worry, Washington Mutual, one of the country's biggest mortgage lenders and a big option ARM player, slipped in a rather stunning confession in its annual filing with the Securities and Exchange Commission.

In the filing, WaMu confessed it had bungled the underwriting for option ARMs, improperly measuring some of its customer's debt-to-income ratios for 2004 and most of 2005. As short-term interest rates rose in those years, the company disclosed, the interest rate at which lenders qualified for loans "was not adjusted upward, which resulted in loans being made to borrowers who were qualified based on debt-to-income ratios calculated using an interest rate below" the prevailing interest rate.

In other words, the applicants looked more credit-worthy than they really were. Talk about violating Rule No. 1 in lending.

Of $43 billion of such loans, WaMu discloses, the unpaid balance for borrowers who were qualified at below the market rates totaled $30 billion.

The bank says it fixed the problem in October. It disclosed the problem in its annual filing this spring, but outside American Banker, few in the media or Wall Street picked it up.

A WaMu spokesman emails that the company expects that "the credit performance of these loans will not differ materially from the expected performance of option ARMs [customers] qualified" at the correct interest rates. WaMu, which says it has more than 20 years experience writing option ARMs through all economic cycles, says that the customers' credit scores and the ratio of the size of the loan to the value of the property were high and that these measures are more important gauges of loan quality.

Option ARMs have been among the most scrutinized exotic mortgage products over the past year. That such an error could creep into WaMu's lending should worry investors not only about the bank's balance sheet but the industry's lending standards as a whole.

Option ARMs didn't go to subprime customers. That's precisely why the coming mortgage problems may not be isolated to customers with poor credit.

Stock today: 42 1 year range: 36.64 - 47.01

Tuesday, August 29, 2006

Days on the market: Contra Costa - Alameda


Seasonal factor plays an important role in the housing market. When the market peaks in May, the number of days listings stay on the market declines to the bottom. And when the market slows down in January, active listings spend more days on the market than any other time of the year. The number of days on the market hit the high of 42.90 days in January 2005. It then climbed to a higher high of 46.21 days once again in January this year. Another higher high in January 2007 would confirm the long-term deteriorating trend of the housing market. So, we shall see...

Monday, August 28, 2006

Housing from Northern Trust


The major debate regarding the economy centers on the real estate/housing picture. Last week a headline in the Financial Times read, "Housing Data Not as Gloomy as Bears Think." The article went on to say that house inflation in both the UK and Australia declined to zero, yet nothing bad resulted. Price inflation held low in both places for three or four quarters, and then inflation started up again. In both the UK and Australia central banks have since raised their rates. No disasters there.

The latest issue of Business Week adheres to the same optimism, with an article that's headlined, "Housing: The Roof Won't Collapse on the Economy. As builders adjust their inventories, other sectors will offer plenty of support."

But wait -- the most intelligent piece I've read regarding housing comes from that brilliant economist, Paul Kasriel, of Northern Trust. He notes that the figures for July show that new family homes sold were down 22.2% from July a year ago. At the same time, New family homes for sale in July were up 22.4% from a year ago. The spread between the two was 44.6%. By this measure, states Kasriel, the supply/demand situation for new single-family homes was the worst since July 1972.

Kasriel notes that falling prices for new single-family homes will put pressure on existing home prices, and therefore we can look forward to a decline in residential home construction. Downward pressure on existing home prices will lead to increased mortgage defaults as home-owners may find that the new payments on their variable-rate mortgages amount to more than the declining value of their homes.

Thus the greatest housing bubble in US history appears to be fizzling. I don't know whether this is going to be a slow, tortuous process or more of a shorter-term bursting of the bubble.

The latest Economist magazine includes an article entitled, "What's That Hissing Sound?" A paragraph from the article runs as follows; "The boom has lifted the (US) economy in three ways: it has boosted residential construction: it has made people feel wealthier and so encouraged them to spend more; and it has allowed homes-owners to use their property as a gigantic cash machine, taking out money by borrowing against their capital gains. Merrill Lynch estimates that the three together accounted for more than half of America's total GDP growth since last year. "Counting construction, finance, and estate agency, the housing boom has been responsible for one-third of all the jobs created since 2001. If house-price rises level off, GDP growth could dip below 2% in 2007. If prices fall, expect a steeper slowdown."

Finally, yesterday's New York Times carried major article which starts by noting the numerous "for sale" signs now dotting the landscape. The article continues, "Already, the housing slowdown has begun damaging the job market. Builders, mortgage lenders, and real estate agencies have stopped adding to payrolls. . . Perhaps the biggest reason to be skeptical about a real estate crash is that the country has not really suffered through one before. Not since the Great Depression has the combined value of residential real estate fallen over the course of a full year."

The Times article includes a fascinating chart, "A History of Home Values," which was researched and assembled by Yale economist Robert Shiller. The Housing Index starts in 1890 at an index value of 125, plunges to 67 in 1920, then rises to 80 in 1940. Back to 70 in 1942, and then a climb to 110 in 1948. From there the Index rises to 115 during the 1960s. In 1980 the Index moves up to 122, and then to 123 in 1990. There's a drop to 110 during the later-1990s, but starting in 1997 the Index rockets higher. After careening ever-higher, we find the Index today at a rarefied price of 200. The surge from 110 in 1997 to 200 in 2006 is unlike anything seen before on this chart going back to 1890. Anybody studying the chart must conclude that since 1997 we have been experiencing an unprecedented housing bubble.

My own "take" on the whole picture is that home prices and condo prices are heading lower, possibly in an extended, tortuous decline. And God help us if home prices regress to the mean. If that happens, prices could easily lose 40% to 50% on balance.

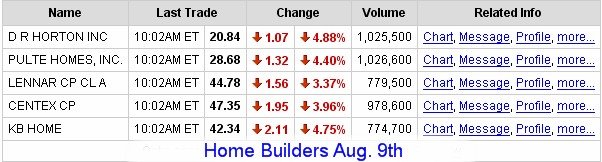
The major home builders have taken a huge beating. TOL has declined 61%, which is typical for the home-builders. The stock is now oversold, and probably ready to rally with the rest of the home-builders. Optimists who are predicting a soft landing in real estate will probably applaud a rally in home building stocks as a "sign of a change." But the rally will simply be a "dead cat bounce" from a severely oversold condition.

Saturday, August 26, 2006

Lake Tahoe Fire Lookouts ~PHOTOS~


How about some nice views of Lake Tahoe from fire lookouts I visited last week.

Click here: Lake Tahoe Lookout Photos

Doug

Friday, August 25, 2006

Tech stocks: now and then


Ebay, Yahoo, Amazon, Google and even Microsoft. And it's interesting --Yahoo's hit a high of 125, it's now selling for 25. Amazon's high was 113, it's now selling for 28. Ebay's high was 58. It's now selling for 25. Microsoft's high was 55, it's now selling for 26. The latest entry, Google, hit a high of 476, today it's selling at 373.

Could this happen to housing.

It's been said that never has the US economy been so dependent on the real-estate and housing industry. One out of every ten Americans is employed at a job that's real estate-related. Booming home prices have kept American consumers buying and consuming. The whole world, it seems, depends on US consumers continuing to consume. In turn, US consumers have depended heavily on the rising prices of their homes.

Now, it seems, the air is escaping from the housing bubble. And the conventional wisdom is -- "Hey, it's no biggie. So instead of selling my home overnight, now it may take me a few weeks or even a month to sell my home. Soft landing, here we come."

Not quite -- there's a contingent of grouches and curmudgeons who don't believe the soft landing will happen. They believe that housing is going to land on its rump -- but it may take a year or so. They think that the variable-rate crowd is going to get scalped, and that the housing collapse is going to throw the US into recession.

So, we ask, which group is going to be right, the soft-landers or the hard-thumpers? Nobody knows for certain -- how can they? But wait -- the bond crowd seems to know something or at least they're acting as if they know. Today the yield on the bellwether 10 year T-note sank to 4.79%. Declining interest rates are hardly a prediction of a booming economy, they're a vote for a sagging economy with very little in the way of inflation.

Thursday, August 24, 2006

Sacramento Forclosures: soar 118%


At the Sacramento County Courthouse, it used to be that foreclosure auctions happened once a week. Now, several times a day homeowners are seeing their American dream turn into a nightmare.

In Sacramento County during the second quarter of this year, the number of homes going into foreclosure stood at 1,866. That compares to 857 forclosures for the same time last year -- an increase of 118 percent.

From: KCRA TV 3 news

Wednesday, August 23, 2006

Home sales drop 4.1% in July and median prices drop


July inventory of unsold homes was highest ever

Supply would take 7.3 months to sell. Median prices drop in West, Midwest and Northeast.

Inventory of homes for sale has surged to the highest level in 13 years. There are now 3.86 million homes for sale

Lowe's (LOW), the nation's second-largest home-improvement chain, said Monday that a slowing housing market will hurt its earnings for the rest of the year.

Last week the National Association of Home Builders reported that confidence among builders sank to a 15-year low.

From USA TODAY

Tuesday, August 22, 2006

Toll Brothers: 57% slide


The performance of the luxury home builder Toll Brothers stock is the financial market's view of the once high flying home builders industry. In the past 13 months, Toll Brothers stock lost approx. 57% of its value. In addition, Toll Brothers Inc. reported this morning its fiscal third-quarter profit fell 19% as a downturn in the housing market resulted in a dip in revenue and caused the company to reduce the number of lots it controls.

Monday, August 21, 2006

Revision to the mean: 30% drop in prices


Summary:


** 32.6% of new US mortgages and home equity loans in 2005 were interest only, up from 0.6% in 2000

** 43% of first-time home buyers in 2005 put no money down

** 15.2% of 2005 buyers owe at least 10% more than their home is worth

** 10% of all home owners with mortgages have no equity in their homes

** $2.7 trillion dollars in loans will adjust to higher rates in 2006 and 2007


At the end of 2003, 1% of Washington Mutual's (WaMu's) option ARM (adjustable rate mortgage) loans were in negative amortization (the borrowers were borrowing more money each month, not even paying enough to pay the monthly interest charge in full). At the end of 2005, 47% of WaMu's option ARM's were in negative amortization (55% by value of the loans).


WaMu is booking these negative amortization payments as earnings. In prior times, loans where borrowers were making less than the interest payments would be classified as non-performing loans. In January-March, 2005, WaMu booked $25 million in earnings from negative amortization payments. In the same period in 2006, WaMu booked $203 million in earnings from these payments. These borrowers are increasing their mortgage balances as property values have started falling, so the default risk on these loans is extremely high.


Mr. Witter estimates that a simple revision to the mean suggests a 30% drop in residential property values in the US over the next three years. This is without considering in the effect of further increases in energy prices.

Wednesday, August 16, 2006

The 10% rule in real estate


I say that if you buy a house, and you can't rent that house and cover all your costs with that rental -- then the house you bought was overpriced .

The cost figure I have always used is 10 percent. If you figures the interest lost if you buy the house for cash, and if you figure the mortgage cost when you buy the house "on margin," and then add the costs of repair, upkeep, and taxes, you'll find that the annual cost of any house is 10%, no matter how you cut it.

People are always surprised (some are shocked) when I tell them that the house they buy will cost them 10% annually. They tell me that I'm nuts, and that my calculations are all wrong. So then I say, "OK, let's sit down and figure it out on paper." So we do the math, and my chagrined friend ends up conceding that I was right.

Is real estate ever a good buy? Of course it is -- real estate, like stocks or bonds, is a great buy when it's cheap. Real estate is not cheap today -- so consequently real estate, in general, is not a good buy today.

I need a home. I've got to buy something now."

Hey, the market isn't interested in your finances or your problems or the fact that you "need a home now." You have to have a place to sleep? Your family needs a roof over their heads? Then it's probably better to rent a place. At this time, renting make more financial sense than buying a home. By next year, that should begin to change, at least, that's my view.

Tuesday, August 15, 2006

Gold and our Debt.


An article in last week's Financial Times notde that the US government maintains two sets of books. The book that we never see deals with national debt and legal obligations of the US. The total of what the US owes come to the staggering sum of $79 trillion dollars.
This is a bit more than what the Bush administration claims. The so-called "President's Budget" issued by the Department of Management and Budget shows that the deficit for 2005 was $319 billion. The rather secret Financial Report of the United States issued by the Treasury states that the deficit was $760 billion.

In the face of these facts, Americans have only one true defense against this depressing long-term picture. And that's to own gold or real money. I say this because the dollar is doomed as is every fiat paper currency that has ever been created. The question is not a matter of whether, it's simply a matter of timing. The fundamentals which will lead to the dollar's demise are already literally set in stone.

What about protecting oneself in another currency? The problem is that the reserves of every nation are largely in US dollars. If the US dollar goes, it will take down every other paper currency with it. Despite the logic of this picture, many central banks are now diversifying by adding other currencies to their mix. Some such as China and Russia are increasing the meager gold portion of their foreign reserves.

My guess (prediction) is that somewhere ahead as the bull market in gold reaches it's third or final phase, we'll see a worldwide panic to own gold. The panic will include holders of fiat paper from around the world as well as the various central banks of the world. The panic for gold lies a few years to perhaps ten years ahead.

Holders of gold can relax in the knowledge that the only money that cannot go bankrupt is the intrinsic money that we call gold. This is the fact that no government and no central bank will admit to or deal with. It's the reason why, over the ages, nations and wise men have always opted to accumulate gold. Gold has always gone to the most powerful nations and the wealthiest individuals.

My own guess is that at worst gold will correct back to the steeper trendline at 600. At best, my guess is that gold will continue to fluctuate in the 625 to 650 area, work off its overbought condition, and then head higher.

In the meantime, more and more fiat paper will flood the global economy. The greater the sum total of the world's debt, the greater the amount of paper needed to service those debts. The totals of debt in the US are far too great ever to be paid off. At least they will never be paid off in dollars which have anywhere near today's purchasing power.

Dec. gold was down today 6.40 to 632.90

Contra Costa/Alameda inventory SOARS


Inventory up 10 times since Jan. 2005 After surpassing 14,000 units in the beginning of August, the inventory of available property listings for sale continued to climb higher and reached 14,348 units as of the end of business day yesterday.

Friday, August 11, 2006

Recession: probability now 70%


The odds that the US will slide into recession have risen since last month from 50 per cent to 70 per cent by my estimates.

The implications will be felt globally. The rest of the world will not decouple from the US economic train, as some analysts predict. When the US sneezes, the rest of the world still gets the cold.

The US recession will be triggered by three unstoppable forces: the housing slowdown; high oil prices; and higher interest rates. The US consumer, already burdened with high debt and falling real wages, will be hard hit by these shocks.

The effects of the housing slump will be more severe than those following the technology bubble implosion in 2001. The negative wealth effect on consumption of falling housing prices - and the related sharp fall in home equity withdrawal - are also larger than the wealth effects of the collapse of tech stocks in 2000. Property, unlike the tech stocks, is a significant part of household wealth. Finally, about 30 per cent of US employment in the latest recovery has been related to housing.

Higher investment in equipment and software, expected to offset lower spending on housing and consumption, is instead falling.

There are now serious limits to monetary easing; even though global inflation is up, fiscal policy cannot be eased as almost all of the G7 countries face serious fiscal imbalances.

From: www.rgemonitor.com

Thursday, August 10, 2006

Rent vs. buying at an all time high


"The last time home affordability fell to such an extreme was in 1981, but that was because interest rates jumped from 13% to 16%," says Hessam Nadji, a managing director for Marcus & Millichap, an investment brokerage firm.

"What's alarming this time is that interest rates are still historically low. That means rents need to go up, and home prices to come down in some areas, for the balance to be regained. And that may be a painful process that takes between a year to 18 months."

In San Francisco, where the median home costs about $760,000, apartment rents have jumped 15% in the past two months, says Janan New, executive director of the San Francisco Apartment Association.

"There is a huge demand for apartments in San Francisco because homes are so unaffordable," she says.

That's still not enough to persuade them to keep their home there. "We've been watching the rents," Seibel says. "But for what we're paying for our mortgage and property taxes, we could be renting a mansion in Pacific Heights."

When the Coffeys were apartment hunting, she called a landlord who had posted an ad on the Craigslist website. "She told me, 'You're the sixth person to contact me, and I've had it listed for 15 minutes.' "

See full story: USA Today rent vs. Buying

What is going on in YOUR rental market.

Wednesday, August 09, 2006

Stock market trends: bearish


The Lowry's stock market figures: The Buying Power Index (demand) stands just above a multi-year low of 294. The Selling Pressure Index (supply) stands just a few points below a multi-year high of 621. The spread between the two indices is a remarkable 327 points. I've never seen such a wide spread before. The buying never seems to come in. And the selling never seems to subside.
Conclusion -- bearish.

What will bring the big money, the important money, into the stock market? I've seen these periods before. And my experience tells me that there is only one thing that will bring in the important money. That one thing is lower prices, highly attractive valuations.

The Lowry's statistics do one thing -- they measure supply and demand. Right now I know that stocks are not in great demand. Further, I know that big money is attuned (as always) to valuations. When stocks sell at low price/earnings and fat yields big money likes them. When stocks are expensive based on high price-earnings ratios and low yields big money avoids them.

As a rule, the public does exactly the opposite. Which is why over any extended period of time the public tends to lose money in the stock market. And it's why, over any extended period of time, investment money tends to win.

So stocks are expensive today. What does that mean for you and me? It means that we should be accumulating money so that we will be ready when the bargains appear. Sure we can buy a little of this or trade a little of that, but that isn't where the great profits lie. The great profits lie in buying top-quality stocks when they are being "given away." When is that? It's at bear market bottoms such as 1932, 1942, 1949, 1974 or 1982.

"I've never seen a soft landing in 53 years." Statement last month by the chief executive of Countrywide Financial Corp, the US's biggest mortgage lender.


There's almost always a bull market in progress -- somewhere. Today the bull market is in real money, known as gold and silver. How much gold and silver do you think the general public owns? My guess is "Next to none."' And that's about par for the course. When the great values are available, the public isn't in them. We're still early in the precious metals bull market. The precious metals bull market may last for many years and go considerably higher (in terms of paper money) before the public decides that it's time to join the upward parade.

In the meantime, what is the public doing? Instead of building cash or assets, the public is going deeper and deeper into debt. And right now, that's a great danger. It's the reason why the Fed will do everything in its power to ward off economic contraction. Contraction is a debtor's worst enemy because contraction and deflation increases the negative power of debt.

It's incredible -- nobody seems to be noticing or talking about the ongoing collapse in the D-J Transports. I've never seen anything like it. Am I on a different planet or what?!

The market acts like some sort of huge, dying animal. It's slowly drifting downward, with stock after stock almost secretly falling apart. I'm looking at Whole Foods, Starbucks, Countrywide Financial, all the home building stocks, Yahoo, Amazon, Ebay -- even mighty Google appears to be fading. It's like investors don't want to believe what's happening. It's as though they're hypnotized and seeing only happy fantasies and sugar plum fairies. Or maybe it's me -- am I looking at the wrong computer site or what?

Toll Brothers: on the slide


Toll Bros. new orders and revenue fell in the quarter just ended, prompting the company to slash for the fourth time the number of homes it expects to build this year, as the U.S. housing market continued its slide.

The news sent shares of Toll down 5 percent and helped drive down most of the other large home builder shares.

Monday, August 07, 2006

Consumer Debt. ~On the rise ~


In May, consumer debt increased by a revised $5.89 billion, the biggest increase since September-October 2004.

Americans are making greater use of their credit cards to finance purchases because rising interest rates and a cooling housing market make it harder for them to take out home-equity loans. Higher prices at filling stations are also prompting consumers to take on more debt, economists said.

It looks as if consumers are relying more on credit cards now that other avenues of credit such as mortgage refinancing have been shut off to them.

Friday, August 04, 2006

10 year T-note and Real Estate


The chart shows a dramatic break of the support to new lows (4.90%) in yields. The yield on the 10 year T-note is a key item in real estate -- fixed mortgage rates are based on the 10 year T-note yield. So yields are declining and there's plenty of money around. The odds on a "soft landing for housing" is coming closer to reality.

Forget interest rates (which are declining anyway) -- today, the money is there in massive quantities. The Fed has made sure the country is swimming in liquidity. And that, in my opinion, is what's been holding this stock market up. Follow the money -- the money is everywhere. The best example -- the New York and Swiss and Hong Kong auction prices. They're unbelievable. Items are going for 20 to 50% over estimates. Recently, a baseball hit by Barry Bonds was sold to a La Jollan for $221,000. As for Wall Street, billions of dollars are available for attractive deals. New hedge funds are formed weekly, and "name" operators start out with billions in new money.

Expired listings: Continue to grow


Contra Costa and Alameda Counties: The combination of expired listings and withdrawn or canceled listings continued to climb higher in the month of July. There were 6,012 units of properties taken off the market in July. Nonetheless, despite this record number of listings being removed from the market, the inventory level continues to grow. This indicates a widening imbalance between the increasing supply and the diminishing demand.

Wednesday, August 02, 2006

Ca. Defaults: Up 67 percent


Mortgage defaults in California rose more than 67 percent during the second quarter, compared with the same period last year.

Twenty-three counties posted an increase of more than 50 percent in the number of notices during the quarter, with Riverside, Sacramento, Placer, Stanislaus and Sutter seeing their share of notices more than double.

This was the fastest since at least 1992, when DataQuick began tracking defaults

DataQuick's president said: "We would have to see defaults roughly double from today's level before they would begin to impact home values much."

Roughly 7 percent of homeowners who receive default notices typically end up losing their homes to foreclosure, DataQuick said.

From Yahoo News.

Tuesday, August 01, 2006

Florida and Wall Street


We recently had two more of Wall Street's finest out on a tour of Florida real estate markets. After the first day, these guys needed diapers. They've been listening to the garbage from home building company management teams and what dribble they hear on the conference calls. I showed them reality, and it hit them like a ton of bricks. Here's a review of reality.

Inventory -- Our current levels are all time highs. We've never seen anything like this. If you want to believe the NAR numbers, so be it. In the previously hot markets, inventory levels are well beyond a year, and in some markets 2-4 years. You have hundreds of thousands of homes in the hands of flippers, not to mention all of the unsold inventory the builders are sitting on, and you still have the normal market of people selling for reasons like death, new job, etc..

Ghost Market -- Why so much inventory? The Ghost Market of so called "investors." These people were not investors. Maybe speculators, but even that is too kind. They were uninformed gamblers. For the last two years, you had better odds at the Big Six Wheel in Vegas. And the builders knew it. The builders saw buyers flipping contracts before closing a few years back. There response was to include a contract provision that you could not assign the contract, and you must close with the builder. They told the Street they were doing this to control investors. Well, that's pure nonsense. If they wanted to keep investors out, they could have demanded sworn affidavits. They could have put deed restrictions in regarding sale and rental of the home. But there logic was not to eliminate investors from the market, but rather to capitalize on them. So with assignments prohibited, the new wave of lemmings had to buy from the builders. And away we go! So now we have a market flooded with people that had no intention of living in the home. When, in the history of the world, have you seen millions of people buying multiple homes like a box of donuts? Like donuts, the value of these homes is dropping as they sit on the market.

Quality - Builders have been selling the vast majority of their homes to flippers. Flippers don't care about quality. Rarely does a flipper order a competent home inspection. Rarely does a flipper even do a walk through. They are only concerned with flipping the contract as soon as they close. The builders did not let this opportunity go unnoticed. They built lower and lower quality homes, often ignoring building codes. How? In many markets the pace of construction has outpaced the ability of the local authorities to inspect homes, so these markets allow the builder to hire their very own private inspectors. Now if you hired an inspector that flagged your homes, how long do you think you would keep that inspector? So the builders find inspectors that are willing to look the other way. Many of the homes on the market today do not meet building codes. We are seeing an escalation of defective roofs, defective trusses, defective stucco and the list goes on. We actually set up a website to help home buyers with information. I'd like to report on all of the home builders, but for now our site is focused on just one builder www.Lennar-Homes.info. We'll be adding new sites over the next few months.

Location - Once again, builders realized they could sell anything as long as they pegged it as "pre-construction." Building next to dumps, rail lines and depressed areas became the norm. Flippers never bothered to visit the sites. Let's look at Miami. Out of area flippers just hear two things. "Miami" and "pre-construction." Our trips through Miami reveal that many of the construction zones are in depressed areas full of crack houses, empty warehouses and worse. The flippers didn't care, and neither did the builders. But the "real" buyers that might live in these condos and homes care. And they are not going to buy these projects.

Cancellations - If you think the cancellation rate is less than 50%, I've got a bridge for sale. Flippers are dumb, but they are not going to wipe themselves out. If they bought a property for $500,000 and it is now selling for $400,000, why would they close? They will simply walk away from their contract, leaving the builder with more unsold inventory. Here's one example to drive this point home. An investor client of ours was recently released from his contract price of $490,000. The builder just resold it for $315,000. That's a "real life" example. That's a 36% haircut for the builder. Margins? There are none at these prices. P/E ratio low? How about no P/E ratios? One final note: The flippers have about 3% in closing costs with the builder. Then they have about 10% with the new buyer. So they need a 13% increase in price to break even. What would you do if prices have already fallen by 20%? Lose another 7% or walk away from the contract?

Affordability - Prices skyrocketed artificially because flippers did not care about price. They only cared about one thing . . . We're they getting pre-construction pricing? Now we have a flood of inventory on the market that buyers cannot afford. First time buyers generally need homes under $300,000. Even in previously hot markets like Port St. Lucie, we saw average home prices rise above $300,000 for pre-construction homes. And the high end market is not immune to this problem either. Buyers that purchase million dollar plus homes are far more astute then the first time buyer. The high end buyers read the Wall Street Journal and follow the numbers. They see the massive build up of inventory, and they all tell me the same thing. "We're looking, but we're going to wait till prices come down." And with that kind of logic, prices will continue to drop.

Interest Rates - Compounding the affordability problem are interest rates. A little over a year ago a buyer could secure a $300,000 mortgage for $1,250 a month (less if they used an ARM). Now the same buyer is looking at a $1,750 mortgage or $6,000 a year more in mortgage payments.