Thursday, June 29, 2006

Mortgage demand drops


Borrowing costs on 30-year fixed-rate mortgages, excluding fees, averaged 6.86%, up 0.13 percentage point, its highest level since April 12, 2002, when it reached 6.92%.

The purchase index, which is considered a timely gauge of U.S. home sales, was substantially below its year-ago level of 477.4.

The group's seasonally adjusted index of refinancing applications decreased 7.5% to 1,356.0. A year earlier the index stood at 2,529.2.

Historically low mortgage rates have fueled a five-year housing boom, helping support the U.S. economy's recovery from recession despite uncertain business investment.

While analysts differ on the existence of a housing bubble, most agree that the market is cooling off from its record run.

The Commerce Department on Monday said sales of new single-family U.S. homes again defied predictions of a slowdown in May and rose 4.6%.

Price reductions


The Alameda/Contra Costa Price Reduction Index tracks the number of listings that reduce their asking price after coming on the market. Higher number of price reduction represents a weakening housing market. After a brief retreat in the beginning of the year, this index is now going almost straight up. This index is also at a much higher level than June 2004 and June 2005 (red X marks).

Tuesday, June 27, 2006

USA Today: price decline in the next two years

Mortgage Reset


The US consumer is loaded with debt. There are $1 trillion of adjustable-rate mortgages that are due to be reset this year, and $1.7 trillion to be reset next year. This means that legions of home-owners will have to cough up 25% more every month -- and in some cases up to 60% more to service their mortgages. This will put a squeeze on millions of home-owners, and many will have to cut back on their spending or even lose their homes.

Remember, it was the boom in housing that saved the US from recession when the market collapsed during 2000 to 2002. Total mortgage debt is now $8.2 trillion while total equity in real estate is about $10.9 trillion. Should home prices fall say 20%, this would mean a loss in home equity of $3.8 trillion, an amount that would certainly put a crimp in consumer spending. With the Bay Area loaded with ARM's - watch out!

Monday, June 26, 2006

Wealth in Ca.

Sunday, June 25, 2006

Highest in four years

The cost for borrowing on homes rose last week -- to 6.73% for a 30 year fixed-rate mortgage: this is the highest cost in the last four years.

Wednesday, June 21, 2006

Contra Costa June stats

Tuesday, June 20, 2006

30 year fixed rate


Monday 06/19/2006: For the week ended 6/9/2006, the average contract interest rate for 30-year fixed-rate mortgages increased to 6.61% from 5.62%, the same period a year ago, for 80 percent loan-to-value (LTV) ratio loans with approx. 1 discount point. Based on our median price of approx. $600,000, this increase represents an increase of $307 monthly, or $3,684 annual mortgage payments, for borrowers putting 20% down. For more highly leveraged loans, the increases in monthly payments are, by all means, much more substantial. However, this would've been fine were there real income increases to support the higher payments. Unfortunately, there have been no significant increases in real personal incomes.

Monday, June 19, 2006

Paying your mortgage


Problems ahead for the housing sector:

Historically, borrowers who run into trouble paying their mortgage tend to do so within the first three to five years of the loan period.

Currently, more than half of the nation's $9.2 trillion in outstanding residential mortgage and home equity loans are less than three years old, said Doug Duncan, chief economist for the Mortgage Bankers Association.

Another potential trouble spot: About 24 percent of all home loans are adjustable, which can be risky if borrowers end up paying far more than they bargained for as the Federal Reserve hikes interest rates.

''Adjustable-rate mortgages always have a slightly higher delinquency rate than fixed-rate mortgages,'' Duncan said.

California, where the median price of a home hit $468,000 in April, leads the nation in the percentage of homes purchased with adjustable-rate mortgages.

Bottom feeders gather outside the courthouse every day for the latest real estate auction. Some are professional investors; others come to ply skills gleaned at get-rich-quick seminars.

All of them are trying to scoop up homes that belonged to others who died, divorced, were thrust into bankruptcy or fell too far behind on their mortgage payments and failed to sell.

Many homes that do end up in court are saddled with more than one mortgage and have little or no equity -- so the investors take a pass.

''In the last six months or so, it has been like this,'' said James Lee, who has mined trustee auctions for investment property for 15 years.

When home price increases were stronger, investors could buy a property and sell it a few months later for a hefty profit.

''Now you're getting into the market where there's plenty to buy, but there's nowhere to sell it,''

Anybody been to one of these auctions lately?

Thursday, June 15, 2006

Response to the Harvard study


From a reader in Hong Kong: The housing market in the US reminds me of the housing
bubble in Japan and Hong Kong in the past.

The rental yield can not cover mortgage payment or put it
this way, home investors must subsidize their tenant
for 3-4% per year if they have one.

If ppty price don't continue to rise, they are stuck
there, not to mention the price has started coming
down since end of last year.

Rising interest rate becomes a threat to all home
owners. Once the ppty price stops climbing,
re-financing is not available. People end up with a
bigger mortgage payment out each month. With zero or
negative saving in US households, it is simply a
question of how long they can stand before falling.

Some say the variable rate mortgages are only 25% of
all and some owners have 10% or above equity in their
home. Thus, it is soft landing! I just can't buy it.


When the HK ppty bubble bursted in 1997, people had
30% or above equity in their ppty and HK people are
loaded with their saving accumulated for the last 30
years. What happened to it? It came down by average
65% from 1997 to 2003.

Now the charts of the big builders tell me that they
have deteriorated since end of last year or beginning
of this year. Now the downturn has spread to other
sectors of economy and even to other parts of the
world.

Cash is definitely King, especially in time of
deflation.

Wednesday, June 14, 2006

Harvard: predicts a "soft" landing


No one questions the thesis that housing has been the big plus in the US economy over the last five years. Now a Harvard study has come out arguing that there will be a soft landing in the housing decline. The study argues that there are fewer points of vulnerability in housing now than was the case in previous market downturns. In spite of the movement toward variable-rate mortgages, 75 percent of mortgage holders have 30-year fix rate mortgages, so rising rates would not affect them. The study also notes the 94 percent of home-owners have equity of above 10% in their homes.

Tuesday, June 13, 2006

Bay Area: Median price


Tuesday 06/13/2006: After it advanced above the previous resistance of $590,000 (blue line), the median sales price appears to have hit a snag at $600,000 mark. Currently, it's stalling right at $600,000 and looking ready to roll over.

Monday, June 12, 2006

Stock market thoughts


Once it's perceived that US housing is in trouble, and that this is deflationary, I expect the Bernanke Fed to do a turnaround. The Fed is mortally afraid of deflation. Bernanke built his reputation on his studies of the Great Depression and the painful results of deflation.

During 1995 to 2000 we saw wild inflation in the prices of tech stocks. The "marvel of tech" plus rising productivity was supposed to usher in a new era for America. Then, following the 2000 top, we saw the tech stocks deflate. The losses were catastrophic, and as of now the Nasdaq stock average is still more than 50% below its year 2000 high.

And I'm wondering whether the same sequence may happen to housing. If housing starts to collapse, as it did in Japan during the '90s, the Fed will oppose those deflationary trends with all the power it can muster. The move to re-inflate will be huge. It should be quite a show.

Rising volatility means that investors are at the stage where they can be easily frightened. They are buying puts for insurance. The Lowry's statistics are very bearish. We have seen two 90% down-days, May 17 and June 5. This is bear market action. Foreign markets have been hit hard, particularly the stock markets of Asia and the Mideast.

Much of the world's surging liquidity has come from Japan and its zero-interest rates. The Japanese "generosity" is starting to reverse. We're seeing the end of the "carry trade" where speculators borrow from Japan at extremely low interest rates and then buy higher interest-rate items, pocketing the difference. The carry trade is now unwinding.

The central banks have created a giant balloon of liquidity, and now the balloon has been punctured. Markets tend to go too far both on the upside and the downside. Now it's the downside's turn. My greatest concern is that the deflating balloon is going to impact the US's DEBT. This could be extremely dangerous. The US economy is not positioned for an attack on its debt. The situation could get nasty.

The first place to feel pain is always the stock market. The most vulnerable area of the stock market is margins, which is simply stock market debt. If the contraction in liquidity continues, it's going to hit margin debt first. That could precipitate anything from a rotten stock market to a crashing stock market.

My advice -- if you're on margin, get off margin. If you have debt that you might have trouble servicing, do everything you can to get rid of that debt. If there's to be real trouble ahead, it will come first from the stock market. The punch bowl isn't just leaking, it's being taken away.

Today's stock market: 754 advances and 2497 declines. Down volume was 89.0% of up + down volume -- very poor action.

Friday, June 09, 2006

Gary Shilling: Predicts a 20% decline

Well, the storm finally arrived. Yesterday at the height of the sell-off, volatility surged to over 20, but later in the session as the market recovered, volatility simmered down to close at 18.36.

One of the earliest tip-offs to market weakness was the weakness in housing. Housing seems to be where it's happening. Roughly half of America's families own stocks or funds or ETFs -- but 69% of US families own their own homes. Last year 40% of all home sales were for second homes, which I must say is pretty wild -- and rather shocking.

Now inventories of new or existing homes for sale are rising -- or I should say surging. The figure is close to 4 million new or existing homes now on the market. So far, the explosion in homes for sale has been due mainly to a release of fresh properties rather than a major slowdown in sales. My guess is that the slowdown is coming.

Gary Shilling said he thinks that nationwide, the median price of homes will fall 20% before the housing decline is over. Gary writes, "Even a 20% price decline will be devastating for many home owners. On average, those with mortgages have a 37% equity in their abodes. Of those who borrowed or refinanced in 2005, 29% have zero or negative equity."

Writing in the current issue of Forbes magazine, Gary says, "A house-price collapse will be far worse than the 2000-2002 bear market on Wall Street and will bring a serious global recession. . . The resulting unemployment will kill many sub-prime borrower's ability to make payments. . .home appliance makers and do-it-yourself retailers are also vulnerable."

Could Gary be right? Phila. Housing Index: The spectacular plunge out of this triangle is obviously telling us something about the home-building industry. I'd call this plunge a warning -- "a red flag" for the housing industry.


If housing does top out, it's going to depress home-owners, and as I said above, 69% of US families are home owners. Taking it from there, I believe we could see consumers cut back on their spending and even start to save. And that probably explains at least part of the huge declines in stock markets around the world, particularly the Asian markets. What I think is happening is that the Asian markets see a decline in the US housing market and therefore a coming decline in US consumer spending. Remember, it's been spending by US consumers that has fired the worldwide economic boom.

Now a few words about yesterday's market action. There was a dramatic intra-day recovery from yesterday's lows, breadth was down, Transports were down and we had over 200 new lows vs.only 27 new highs. Volume was huge, 3.46 billion shares (of course, S&P futures were expiring).

But after the close I received the Lowry statistics on the day's action, and I must say I was surprised. The Buying Power Index (demand) dropped to a new multi-year low while the Selling Pressure Index (supply) rose 8 points to a new multi-year high. In other words, the internal character of the stock market continued to deteriorate even while the market was recovering from its lows.

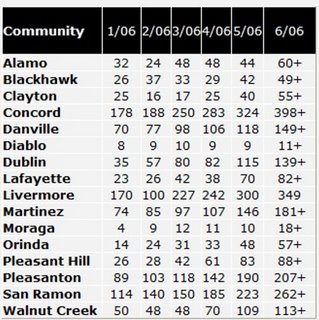
Contra Costa June stats


Click on pic:

Thursday, June 08, 2006

Inventory: Contra Costa and ALameda county


Thursday 06/08/2006: It was only 5 weeks ago on 5/3/2006 when the inventory of all active listings in Alameda and Contra Costa counties broke the 10,000-unit mark. The inventory has grown another 20% since 5/3/2006. This is a 600% increase from just 1,964 units on 12/27/2004.

Foreclosures in Southern Cal: 29% rise


The number of foreclosures escalated throughout Southern California, with a rise of 29.09% since January 2006.

While Riverside had the highest increase of 56.45%, San Diego County had an increase of 49%, followed by Los Angeles up 16.2%.

The houses that were most affected by the foreclosures were single family homes which made up 76% of the activity, 12% were condominiums, and 4% were duplexes and triplexes.

Tuesday, June 06, 2006

Listings withdrawn


Last month, May 2006, the number of listings withdrawn from the market reached a new high of 3,700. The question worth pondering is what happen to these properties. Put them back on the market later?

Stocks and housing

I've said before that housing IS the US economy. Last year US home-owners pulled $750 billion out of their homes through refinancing. What they spend that money on I don't know, but I suspect that one way or another it was spent, not saved.

The chart below shows the Phila. housing index in what I would have to call a free-fall or a crash. I know a lot of analysts are calling for a "soft landing" in housing. I'm not at all sure it will work out that happily. So far, the Phila. Housing Index is in the process of what I call a "hard landing," and, of course, it's not at all clear whether the housing index has hit bottom at all. The true or final bottom may lie many months away.

Looking ahead, if housing really starts collapsing, I would expect the Fed to reverse itself and go all out in reliquifying the economy while at the same time bringing short rates down in a hurry. Housing has been declining even while it was thought that the Fed was finished with boosting rates. Now with the chances of another rate boost this month, I expect housing could take it on the chin. Inventories are high, buyers are loaded with variable-rate mortgages, and interest rates may be heading higher. If you own a home with a big mortgage, cross your fingers. If you are planning to buy a house, my advice is -- wait. Maybe I should make that suggestion a little bigger -- WAIT.

Note -- Both Fannie Mae and Freddie Mac gapped to new lows today, thus joining the ranks of the fading building stocks -- just not a good picture

Please remember this -- there are times when the stock market in its actions impacts on the economy. I'm not talking about the stock market as it discounts what lies ahead, I'm talking about stock market action that immediately affects the economy. This happens only rarely, but it occurs when the stock market either surges wildly higher or when the stock market becomes disorderly on the downside.

If the current decline becomes disorderly (a panic) on the downside, it's going to frighten America's consumers, in which case, they could cut back sharply and rapidly on their spending. It would not surprise me if this is where we're headed now. Therefore, the action of the stock market will be crucially important during the weeks ahead.

Monday, June 05, 2006

90% Down Day

Today looked like it could be a second 90% down day -- the first was May 17th. These 90% down days signify that the stock market is open to panic; 90% down days tend to come in series -- there will probably be more 90% down days coming up.

The markets took the "Bernanke warning" surprisingly hard. Why would one more rate boost of .25% this month be that scary? Hey, I never argue with the market. On the face of it, the market MOST DEFINITELY DID NOT LIKE THE IDEA OF HIGHER INTEREST RATES! Why? Just look at the real estate stocks -- they've been falling apart. What if housing in general unravels? What if defaults surge? What if business slumps in the face of all the debt built into this economy?

The Bernanke Fed wants to halt asset inflation? Be careful what you wish for Bennie, you might get it -- and a lot more that you didn't wish for. Anytime you have this much debt built into an economy, that economy is fragile. Furthermore, US consumers are hardly in a defensive position, hardly ready to deal with rising rates.

The action of the market the rest of the week will be very instructive. As I've been saying, get defensive, be careful, get out of debt.

Housing sector index: Plunges 4% today


Housing sector index: Plunges 4% today

Sunday, June 04, 2006

Expired listings


On the first day of every month, there's always a spike in the number of listing contracts that expire. We've been keeping track of this statistic as one of our housing market breadth indicators. As our local housing market deteriorated, the number of expired listings on the 1st day of the month rose from just 42 units on 9/1/2005 to the record high of 191 units on 5/1/2006. Yesterday, 6/1/2006, this number dropped to 150 units. This is a short-term positive sign that's in sync with our COE Index, which was posted on Wednesday, 5/31/2006.

Thursday, June 01, 2006

State of Ca. gains


California appreciation rates

Quarter 1 2006: 2.5%

Last 12 months: 19.2%

5 years: 115.2%

Since 1980: 534.1%